Selection bias
Gabriel Mesevage
The plan
- The essay
- What is sample selection bias?
- Selection on observables
- Selection on unobservables
- How selection bias distorts relationships between variables
Your essay
3,000 words.
Due on 28 April 2026 before 14:00
Essay question
Discuss the role of theory and measurement in a historiographical dispute in economic history.
Examples you can use:
- The debate over heights, well-being, and the ‘industrialization’ puzzle.
- The debate over the ‘high wage economy’ thesis and why Britain industrialized first.
- The debate over the gold standard, empire, and sovereign bond yields in the 19th century.
- The debate over the measurement of income inequality in the 20th century united states.
Essay question
You can write your own but:
- It needs to be a scholarly dispute
- It needs to be quantitative
- I need to approve it
Essay practice
I will have you write an outline first, and will grade it for you.
We can pick the due date for that together.
From statistical significance to bias
Last week we covered means, standard errors, and statistical significance
Those tools assume our sample is a random draw from the population
But what happens when it isn’t?
If our sample is not random, our estimates may be biased – systematically wrong in a particular direction
No amount of data fixes a biased sample: a bigger biased sample is still biased
The bigger threat
In observational studies the bigger danger is not sampling error but that your sample is systematically unrepresentative of the population
Statistical significance tells us about precision (how much noise is in our estimate)
But bias is about accuracy (whether we are pointing at the right answer)
You can have a very precisely measured estimates of the wrong thing
What is sample selection bias?
Definition: Sample selection bias occurs when your sample is not a random draw from the population you want to study. You are more likely to capture some kinds of people rather than others.
The process that generates your data is not independent of the thing you are trying to measure
This means your sample statistics (means, correlations, etc.) may not reflect the true population values
A simple example: height and the Royal Marines
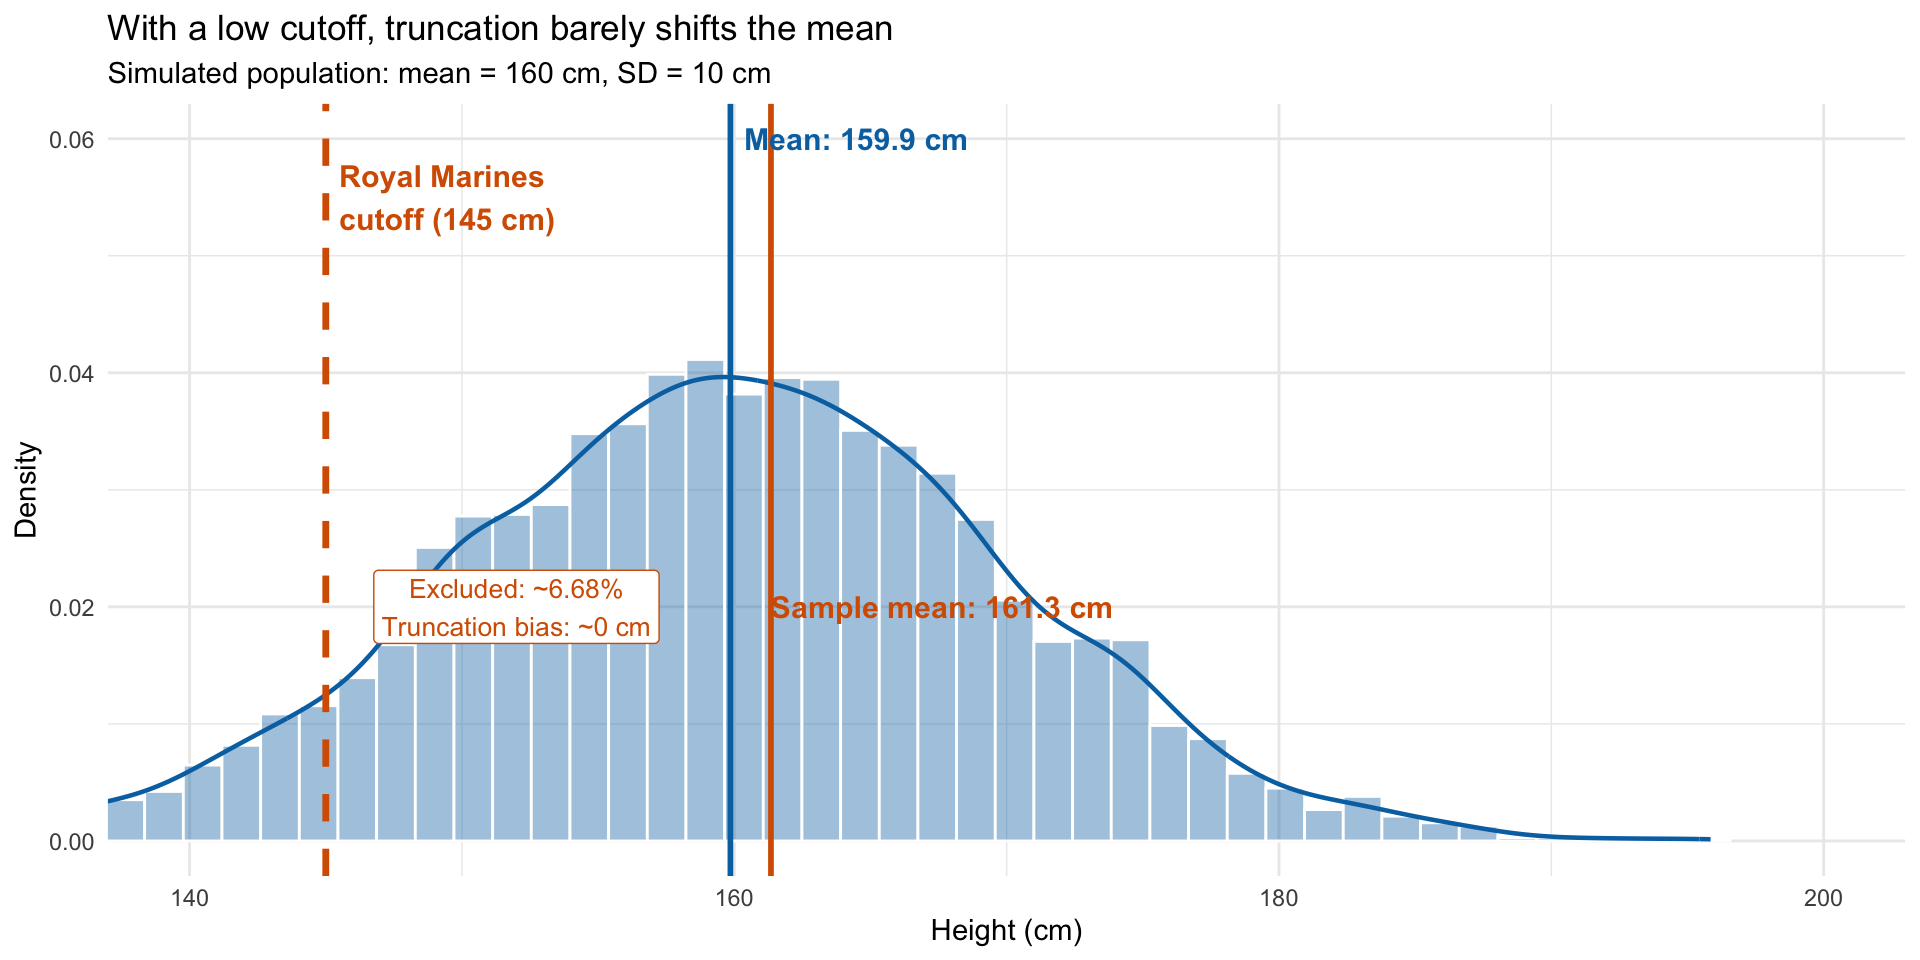
Suppose we want to estimate average height in the population using military records
The Royal Marines require a minimum height of 145 cm
Everyone below the cutoff is excluded from our data
Our sample mean will overestimate the true population mean
This is truncation bias: we only observe part of the distribution
Truncation bias illustrated
Worst-case bounds and missing data
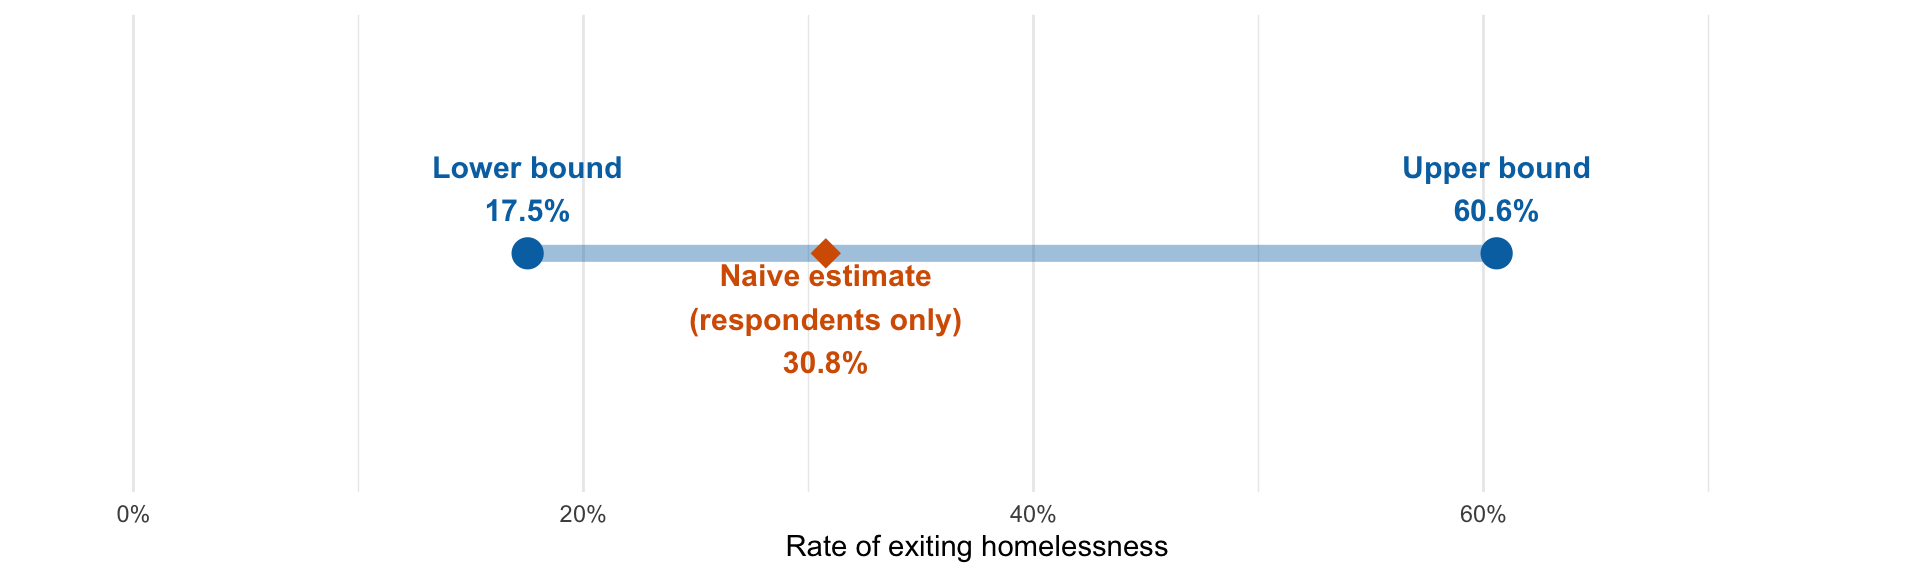
Manski (2007) : A survey contacts 137 unhoused people and follows up later to ask whether they found housing.
At follow-up, only 78 respond. Of these, 24 had exited homelessness.
59 non-respondents: did they find housing? We don’t know.
Lower bound: Assume all 59 non-respondents did not exit \(\rightarrow\) \(24/137 = 17.5\%\)
Upper bound: Assume all 59 non-respondents did exit \(\rightarrow\) \((24 + 59)/137 = 60.6\%\)
Naive estimate (respondents only): \(24/78 = 30.8\%\)
The true answer lies somewhere in \([17.5\%, 60.6\%]\) – a wide range, but an honest one
Worse-case bounds
Selection on observables
Definition: Selection bias that depends on variables you can see in your data.
If you know what is causing the selection, you can potentially correct for it
The key requirement: the variable driving selection must be measured in your dataset
A polling example
Suppose you’re polling voting intentions
Your sample over-represents university-educated voters (60% of sample vs. 30% of population)
University-educated voters favour Party A at 70%; non-university voters favour Party A at 40%
Naive estimate (raw sample): \(0.6 \times 70 + 0.4 \times 40 = 58\%\) for Party A
Reweighted estimate (using population shares): \(0.3 \times 70 + 0.7 \times 40 = 49\%\) for Party A
Because we observed education level, we could fix the bias
Selection on unobservables
Definition: Selection bias that depends on variables you cannot see in your data.
You cannot reweight or control for something you haven’t measured
This is the hard problem: the bias is invisible in your dataset
You need assumptions or external information to address it
Correcting for selection on unobservables
The Heckman correction attempts to fix selection on unobservables
Key assumption: the errors in the outcome equation and the selection equation are jointly normally distributed
High level overview: you assume a specific formula describes the relationship between the unobservables driving selection and the outcome.
Selection bias and relationships between variables
So far we’ve focused on how selection bias shifts averages
But selection bias can also distort relationships between variables
This is sometimes called Berkson’s paradox or collider bias
The key insight: conditioning on a variable that is caused by two other variables can create a spurious correlation between them
Berkson’s paradox: the NBA example
Among NBA players, taller players tend to have worse free-throw percentages
But in the general population, height has no relationship to free-throw accuracy
The NBA selects players who are either very tall or very accurate shooters (or both)
Among the selected group, if you’re not tall, you must be an amazing shooter (otherwise you wouldn’t be in the NBA)
This creates a spurious negative correlation in the selected sample that doesn’t exist in the population
Berkson’s paradox illustrated
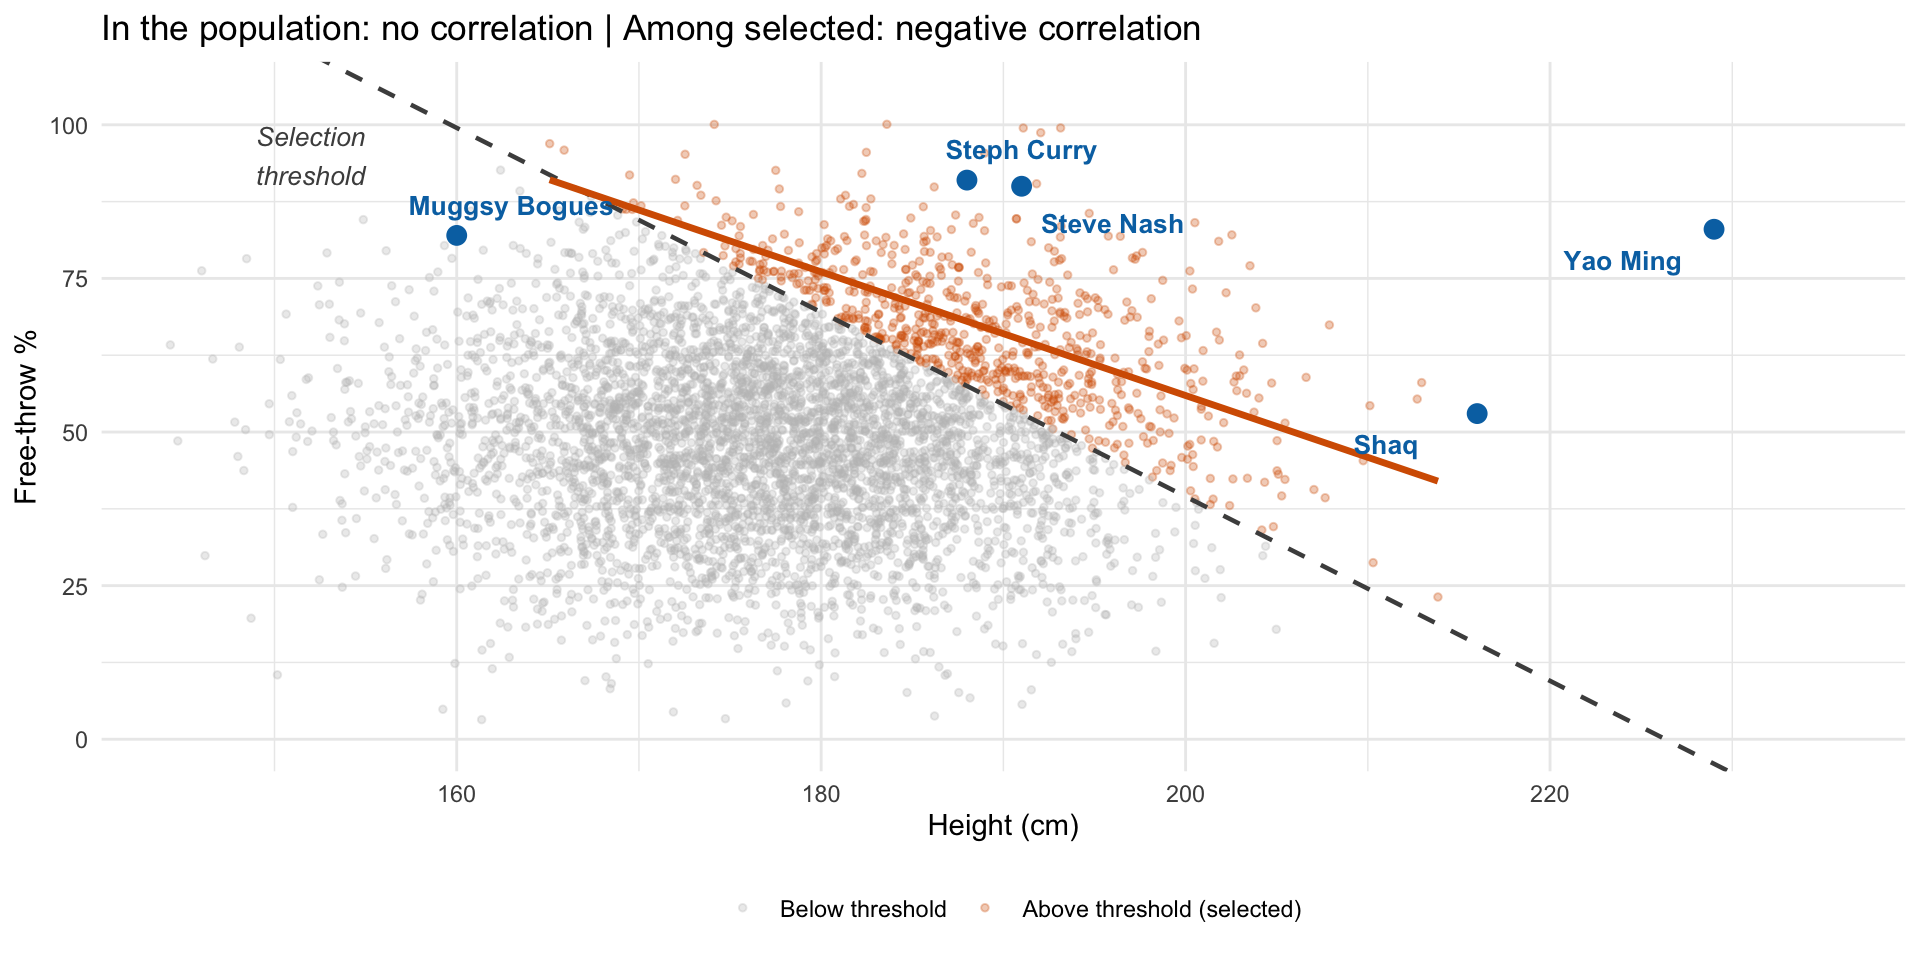
Selection creates a spurious negative correlation (Berkson’s paradox)
Key takeaways
Sample selection bias is often a bigger threat than sampling error in historical research
Selection on observables can be corrected if you measure the relevant variables
Selection on unobservables requires strong assumptions to correct (e.g., Heckman’s joint normality)
Selection can distort relationships between variables (Berkson’s paradox), not just averages
Always ask: who is in the sample and why?
Bibliography
Manski, Charles F. 2007. Identification for Predication and Decision. Harvard University Press.