Measuring GDP
Today’s plan
- The origins and purpose of GDP
- Data quality: what do we actually know about GDP?
- Hedonic pricing: measuring the price of services, not goods
- Exercise: the price of nails
What is GDP?
GDP measures a flow of economic activity within a particular location over a particular period of time
Three equivalent approaches to measurement:
- Expenditure: sum of all spending on final goods and services — \(C + I + G + (X - M)\)
- Income: sum of all incomes earned in production
- Output: sum of value added at each stage of production
In principle all three give the same number; in practice they diverge
Summary point: GDP is primarily a tool for economic planning not a measure of welfare
Early modern precursors
- Coyle (2014) opens with the claim that “GDP is one of the many inventions of World War II”
Early precursors:
William Petty (1660s): estimated English income, expenditure, population, and assets — explicitly to show England could finance war against Holland and France
Charles Davenant: similar exercises in England
Jacques Necker (France): national accounting geared towards showing the ruler the fiscal capacity of the state for war
These early efforts are instruments of statecraft, usually for war
Conceptualizing national income
- Adam Smith drew a sharp line between productive and unproductive labour in The Wealth of Nations:
There is one sort of labour which adds to the value of the subject upon which it is bestowed: There is another which has no such effect. … The labour of a menial servant, on the contrary, adds to the value of nothing. … A man grows rich by employing a multitude of manufacturers: He grows poor, by maintaining a multitude of menial servants.
Excludes much of services from national income
The prejudice was echoed by Marx; the Soviet Union “largely ignored service activities” (Coyle 2014)
By the late 19th century, Alfred Marshall and others pushed for an expansive view closer to modern usage
Interwar institutionalisation
National income estimation became more formalised in the interwar period, linked to understanding the economic crises of the time
UK: Colin Clark produced national income and expenditure estimates; appointed in 1930 to the National Economic Advisory Council
US: Simon Kuznets worked under President Roosevelt to adapt these methods; his first report to Congress in 1934 estimated national income had halved between 1929 and 1932
This offered a far more complete picture than what Hoover had been working with: scattered industrial statistics and share prices
Kuznets: welfare vs output
Kuznets recognised he was producing an output series, but thought welfare was the more important and interesting problem
He wrote in 1937:
It would be of great value to have national income estimates that would remove from the total the elements which … represent dis-service rather than service. Such estimates would subtract … all expenses on armament, most of the outlays on advertising … and what is perhaps most important, the outlays that have been made necessary in order to overcome difficulties that are, properly speaking, costs implicit in our economic civilization.
- This was not what the US government wanted (Coyle 2014)
The wartime battle
By the late 1930s the US government needed national accounts that showed productive capacity for war — and that included government expenditure as part of output
Earlier definitions generally excluded government spending; as government expanded at the expense of the private economy, GDP would appear to shrink
The first official American GNP statistics (1942) included government expenditure and were designed to analyse the burden of the war
Kuznets remained skeptical: including government spending “tautologically ensured that fiscal spending would increase measured economic growth regardless of whether it actually benefited individuals’ welfare” (Coyle 2014)
The conceptual shift
The modern settlement: government consumption is included in GDP.
Given government consumption is around 18% of GDP in modern OECD countries this is a big difference, and sensible to include
But Kuznets’s point has force: a $1 billion bridge to nowhere is measured by its cost — an input measure, not a welfare measure
Some economists have argued that Chinese GDP growth has similar cost/output issues
GDP measures economic activity, not welfare
GDP as empirical construct
- Richard Stone, a pioneer of national accounts in the UK, emphasised that GDP is a theory-laden construct, not a fact (Coyle 2014):
To ascertain income it is necessary to set up a theory from which income is derived as a concept by postulation and then associate this concept with a certain set of primary facts.
Different theoretical frameworks would yield quite different measures
The UN System of National Accounts states explicitly that the accounting framework “is designed for purposes of economic analysis, decision-taking and policymaking” — not welfare
Two key features: (1) theory-dependent, (2) geared to economic management, not welfare measurement
Beyond GDP
Recognition of GDP’s limits has prompted alternatives aimed more explicitly at welfare
Stiglitz-Sen-Fitoussi Commission (2009): recommended supplementing GDP with measures of inequality, sustainability, and subjective well-being
Human Development Index (HDI): Amartya Sen and Mahbub ul Haq — combines income, health, and education; used by UNDP
These are important but raise their own deep measurement problems: how do you combine health and income into a single index?
Different question: how well GDP itself is measured
Jerven: the veneer of accuracy
Jerven (2013) argues that GDP statistics for sub-Saharan Africa present a veneer of greater accuracy than is warranted
The answer to “what do we know about income and growth in sub-Saharan Africa?” is “much less than we like to think”
The core issue: where to place the production boundary — what counts as economic activity?
Pigou’s famous example: if you marry your cook, what happens to GDP?
The boundary is a conceptual choice, not a natural fact — and different choices yield very different numbers
The base year problem
To measure real (inflation-adjusted) GDP you need a base year in which prices are held constant
The base year also defines the sectoral weights: the relative size of agriculture, industry, services, etc.
As sectors grow at different rates and relative prices shift, the base-year weights become increasingly misleading
IMF best practice: rebase every five years — but this is rarely followed in low-income countries due to cost
Consequence: GDP figures reflect the structure of the economy in the base year, not today — introducing systematic bias
Ghana’s GDP revision
Ghana was using 1993 as the base year until the mid-2000s
In 2010 they updated the base year to 2006 sector weights and prices
Result: measured GDP jumped from cedi 21.7 billion (old base) to cedi 36.9 billion (new base) — nearly doubling overnight
One concrete problem with the 1993 base:
- Ghana has a large and growing telecoms sector — but its contribution was measured using 1993 landline-era weights and prices
- The mobile phone revolution was essentially invisible in the old accounts
Jerven (2013): the statistics are not fabricated but unreliable, and costs of collection result in very variable quality
The core measurement problem
Even if data collection is perfect, price indices face a deeper challenge: they track the prices of goods, not the prices of the services those goods provide
Nordhaus (1997):
For many practical reasons, traditional price indexes measure the prices of goods that consumers buy rather than the prices of the services that consumers enjoy.
This matters whenever goods change quality or are replaced by new products
- A laptop in 2025 and a laptop in 1995 are both called “a laptop” — but they are radically different objects
- Tracking the price of “a laptop” misses the enormous improvement in computing services per dollar
Hedonic pricing (from the Greek hedone, pleasure): price the bundle of services goods provide, not the goods themselves
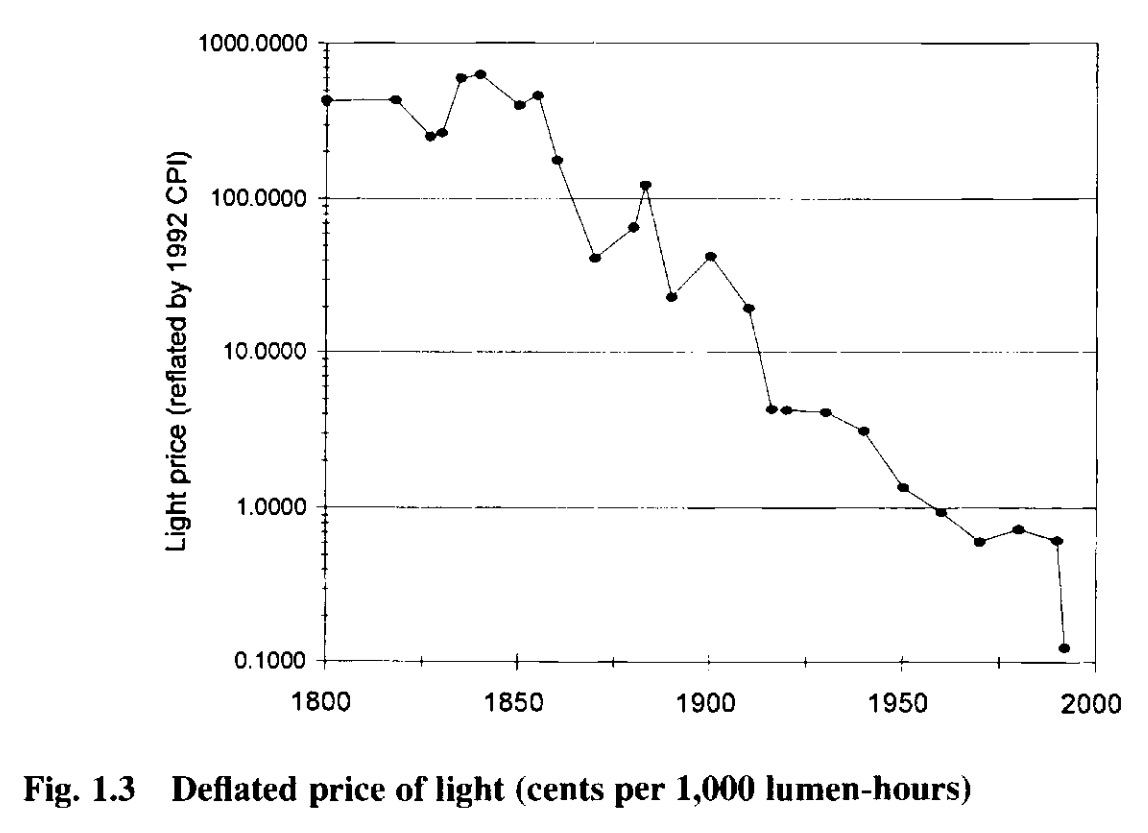
Nordhaus: measuring the price of light
Nordhaus (1997) chooses a deliberately simple case: the price of illumination
People do not want candles, whale oil, kerosene, or electricity — they want light
The service can be measured cleanly: lumens per watt — units of illuminance per unit of energy input
This allows Nordhaus to track the price of the service rather than the price of the energy source
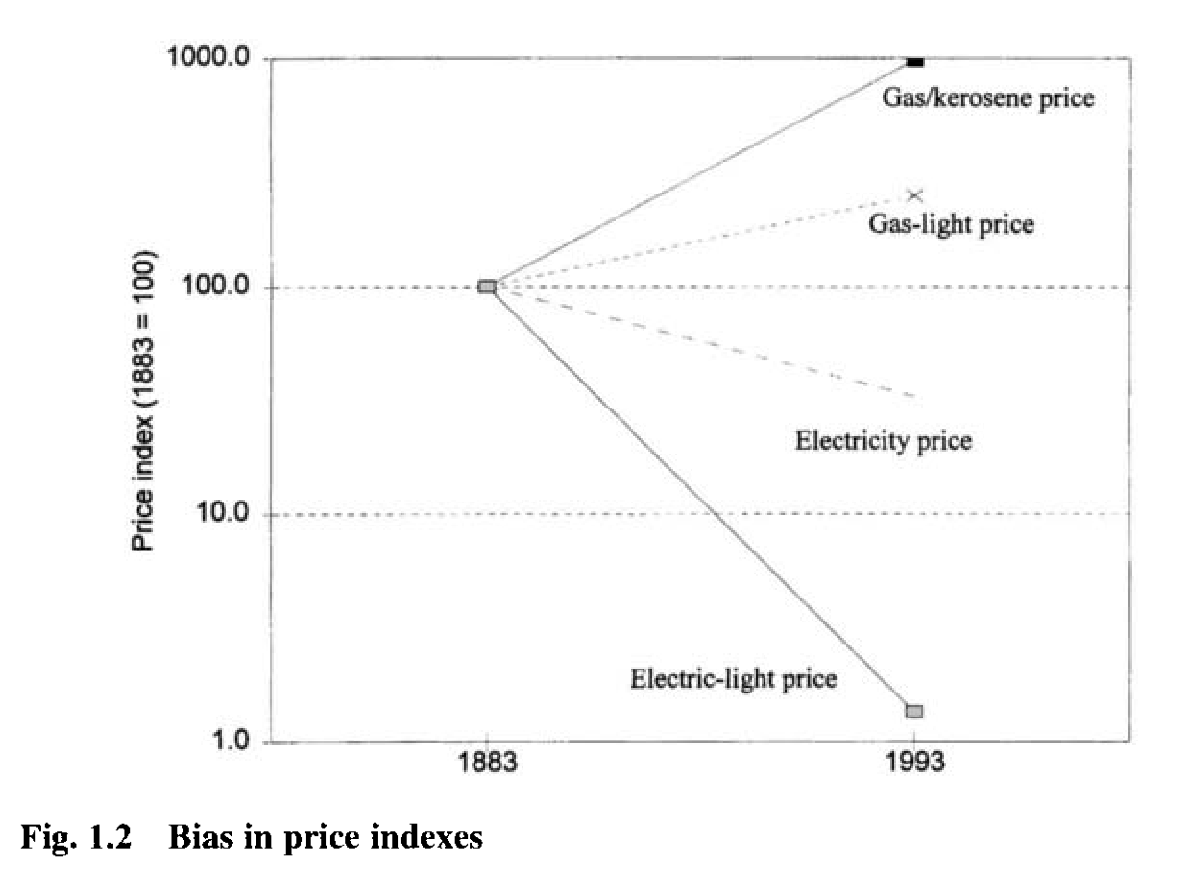
The key insight: as technology changes (candles → gas → electricity → LEDs), traditional price indices track a shifting set of goods; Nordhaus tracks a fixed service
Result: the true fall in the cost of light is far larger than traditional price indices suggest
Bias in price indexes
The price of light over time
The labour-hours measure
- Nordhaus extends the hedonic argument by expressing the cost of light in labour hours:
One modern one-hundred-watt incandescent bulb burning for three hours each night would produce 1.5 million lumen-hours of light per year. At the beginning of the last century, obtaining this amount of light would have required burning seventeen thousand candles, and the average worker would have had to toil almost one thousand hours to earn the dollars to buy the candles. (Nordhaus 1997)
Not only is light much cheaper — the time we must devote to earning it has fallen even further
Modern practice: US statistical agencies now “quality-adjust” price indices — a new car’s price is adjusted for mileage, safety features, fuel efficiency — tracking the services the car provides, not just its sticker price
This remains contested and difficult: how do you price all the services bundled in a smartphone?
The nail price exercise
We now work through a similar exercise using the price of nails (Sichel 2022)
What kinds of services do nails provide?
The data: real price of a nail in 2012 US cents, 1695–2019
- Source: Sichel (2022), matched-model index (column PRMATCHCN)
- Splices together hand-forged, cut, and wire nail price series
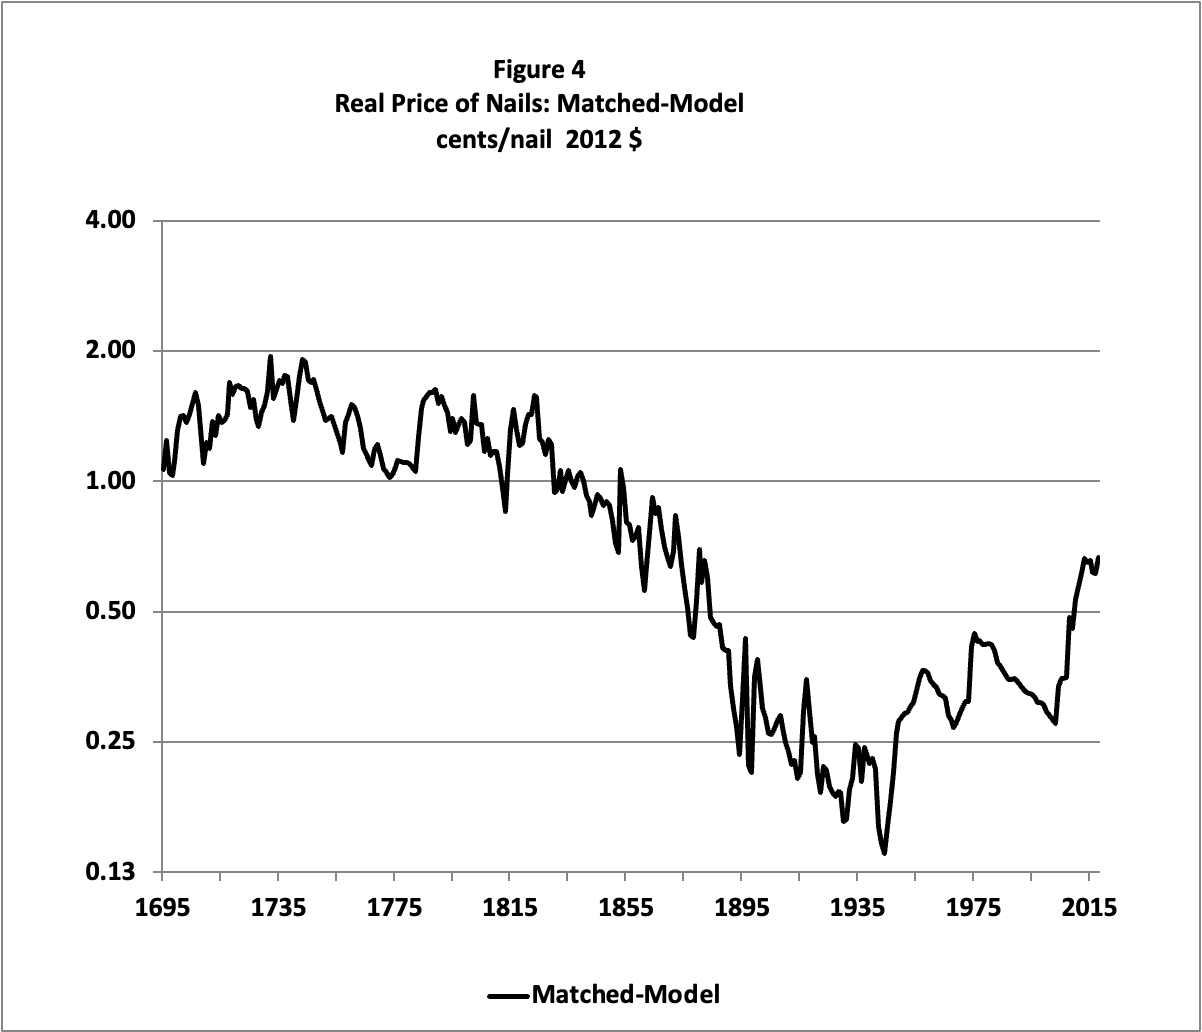
A history of nail technology
| Period | Technology | Key change |
|---|---|---|
| Roman era – 1820 | Hand-forged | ~1 minute per nail by a nailsmith |
| 1790s – 1890s | Cut nails | Machine-cut from iron/steel sheet; steam-powered rolling mills |
| 1880s – 1920 | Wire nails | Drawn from wire; 300–450/min by machine |
| Early 1980s | Pneumatic nail guns | First appear in Sears catalogue |
| Today | Fully automated | Some machines: 2,000 nails/minute |
Note: the 1880s–1890s saw overlapping use of cut and wire nails during the transition period.
- What does this imply for a traditional price index vs a hedonic one?
Exercise
Open the data file: nail_prices.xlsx
The spreadsheet contains: Year and Real_Price_Cents_Per_Nail_2012USD (Sichel’s matched-model index, column PRMATCHCN)
Questions to consider:
What services do nails provide?
Have those services changed?
If you were constructing a hedonic price index for nails, what unit of service would you use — analogous to Nordhaus’s lumen-hours per dollar?
Do you think a hedonic adjustment would make the price fall look larger or smaller than the raw series? Why?
Construct an ad-hoc adjustment based on assuming changes in the quantity of the service provided by nails to the existing price series to get a new ‘hedonic’ price series.